SCHEMATICS

It has been a busy couple of days, so also the blog post got delayed, but finally here it it is! First, I would like to mention @FreAmeLie, who requested this topic and encourage everyone to follow her footsteps.
Schematics are commonly used in publications to facilitate the understanding of the procedures and the experimental setup. Generally, schematics should be simple, clear, and easy to follow. What does that mean in practical terms?
1) involve only the necessary elements (additional/artsy elements carry a risk of distracting the audience)
2) follow the timeline (either horizontally of vertically)
3) use colors cautiously (not all the elements have to be colored; highlight the important parts; match the color to the graphs which will follow the scheme)
So let's try to apply those rules to this schematic from recent Neuron publication by Brancaccio et al.:

Let's first see how it plays according to the rules:
1) there is a lot of text, graphical elements that are not necessary (outlined slice, repeated constructs and viruses), which cloud the overall image
2) the above graphic "starts" in the center and moves in right or left depending on the applied virus
3) there is some beige, light yellow, light red, blue, red, black, grey, but do those color have a meaning? or do they seem random?
To remake the graphic I first selected the most important elements of the experiment: floxed mice (with constructs they express), applied viruses, induction of selective expression, and performed measurement.
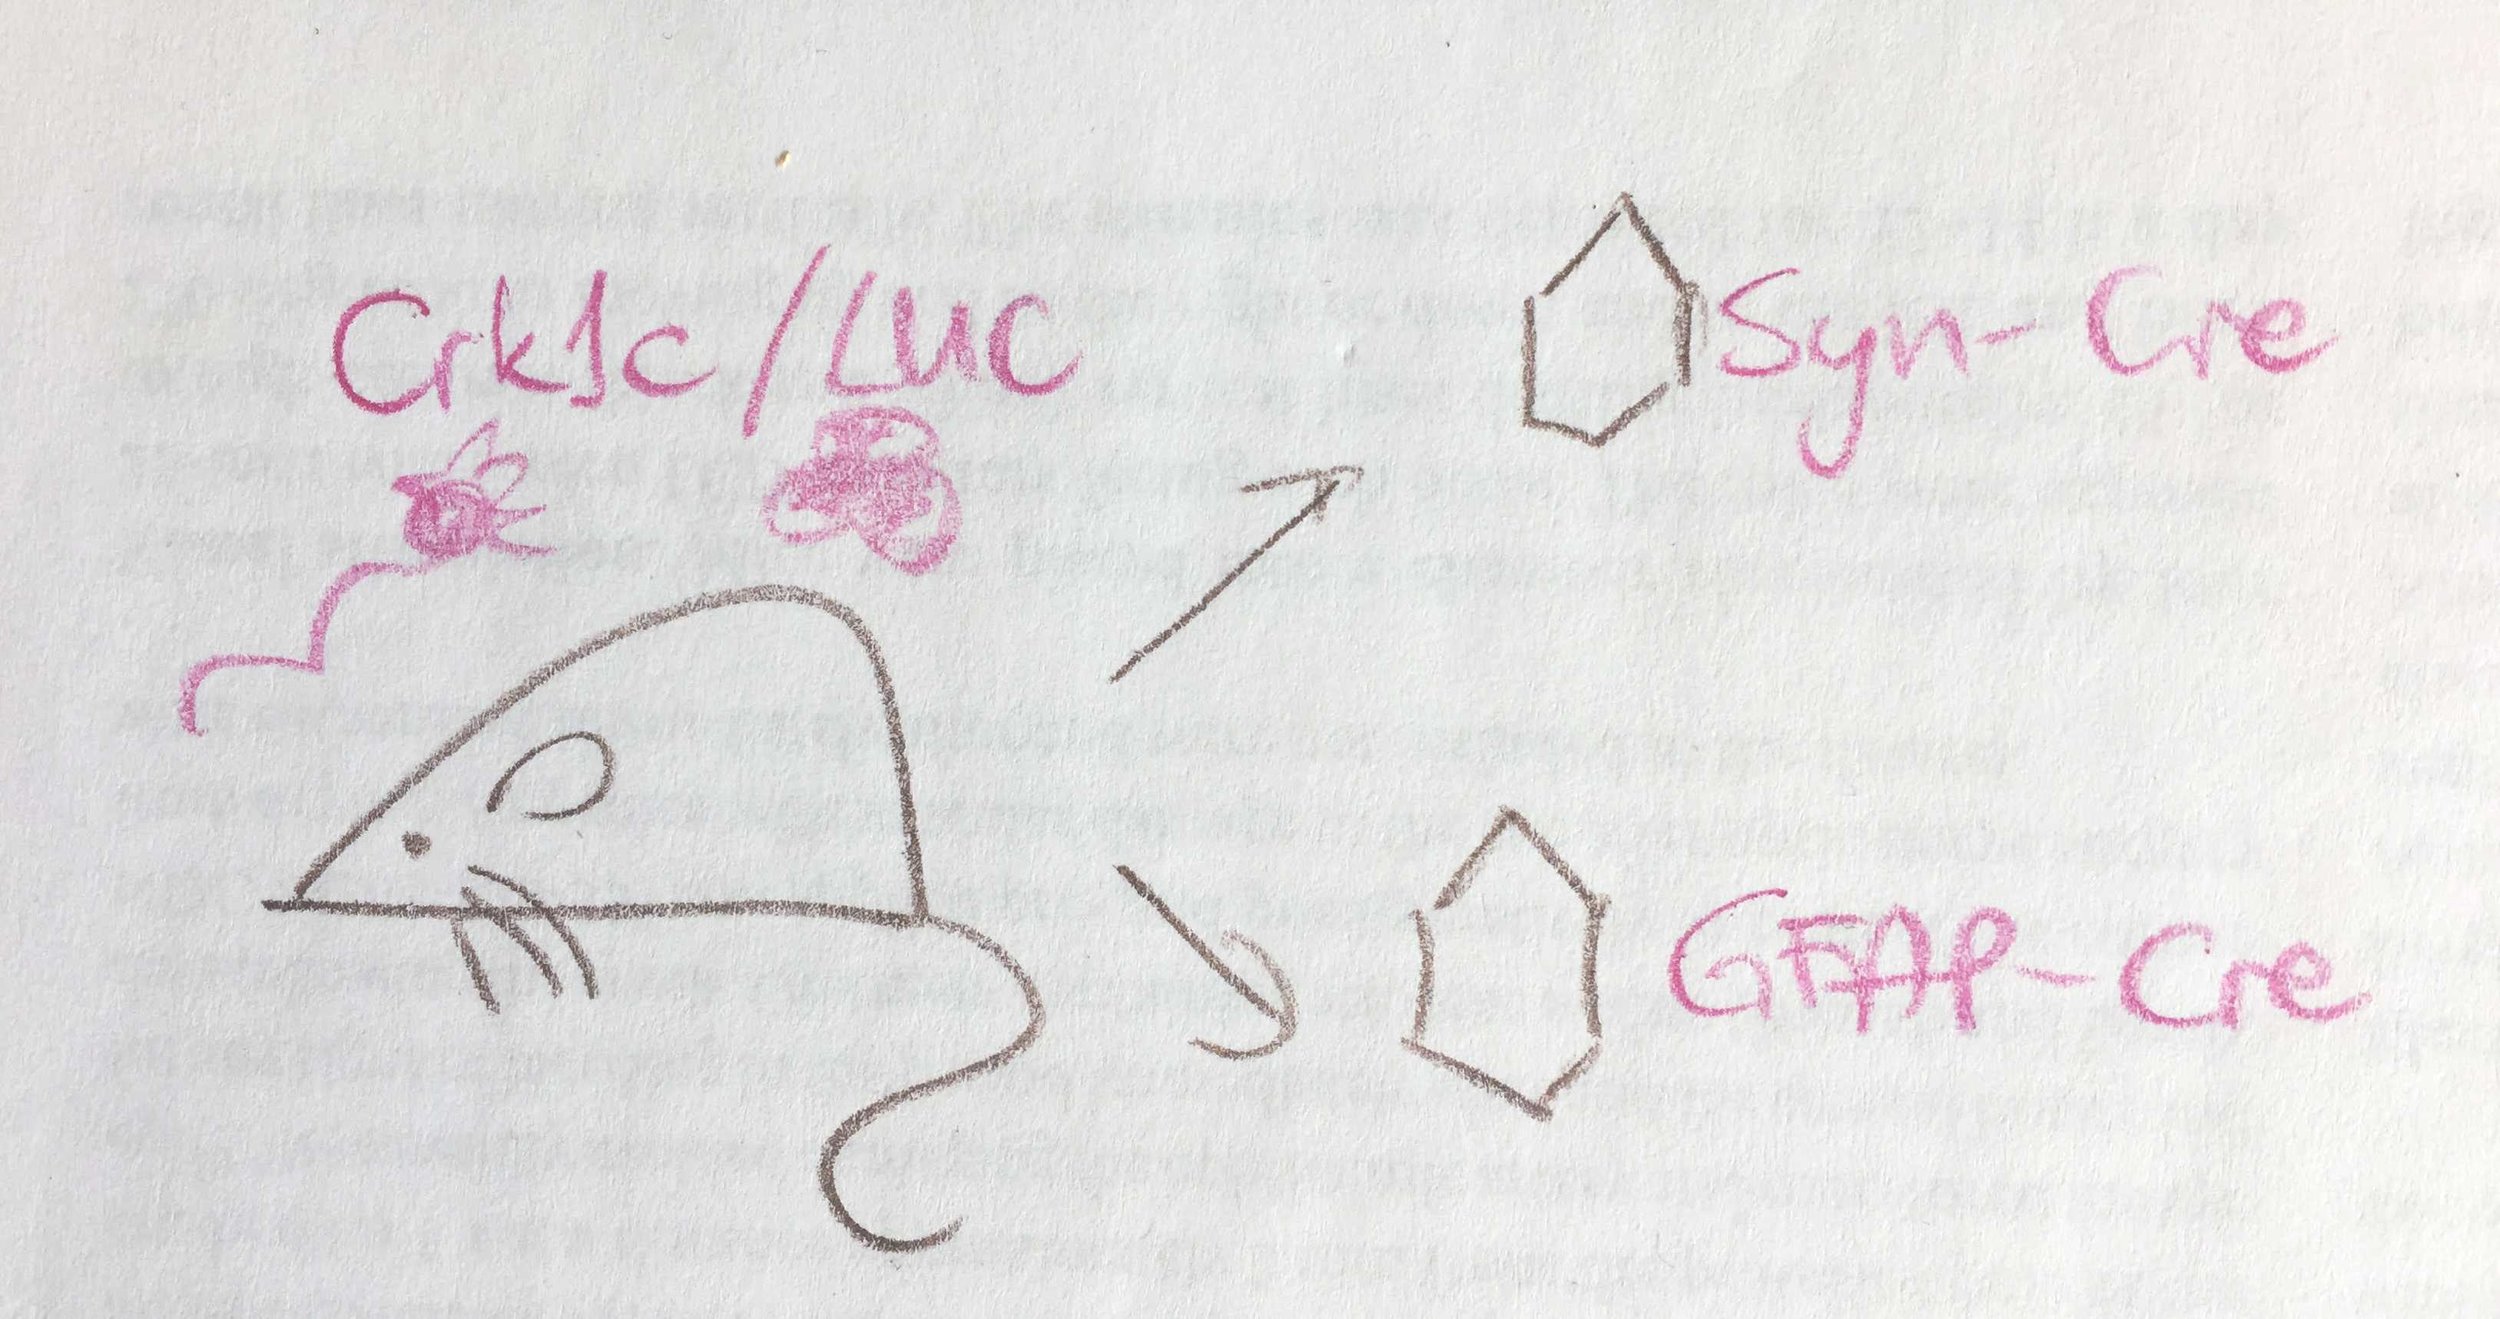
As you can see rather than using Illustrator I made a simple drawing. I very strongly encourage you to do the same when you start with your own work. Starting at the computer means investing time and effort, which means you will be less likely to change the concept entirely and start from scratch. Drawing will take a minute and you can easily try different ideas.
Back to the schematic at hand:

Once you name the elements required to understand the experimental design, you can put them in a timeline (or spatial arrangement, for example if you are showing a microscope design):
Once you settle on the design, you can turn it into a graphic on your computer:

The most important improvements involve:
clearer timeline, highlighting that application of viruses causes recombination in selected type of cells, and after 4 days mice are subjected to measurement of TTFL (transcription-translational feedback loops). Moreover, use of orange and blue highlights that those colors will be use in the quantifications of those conditions in the next panels.